监控工具
TiDB_2">TiDB数据库的监控体系
promethues : 时序数据库
TiDB_Dashboard_6">TiDB Dashboard

- 了解集群整体运行概况
- 查看组件及主机运行状态
- 分析集群读写流量分布及趋势变化
- 列出所有SQL查询的耗时等执行信息
- 详细了解耗时较长的SQL语句的执行信息
- 诊断常见集群问题并生成报告
- 查询所有组件日志
- 收集分析各个组件的性能数据
这个Dashboard 是包含在PD当中
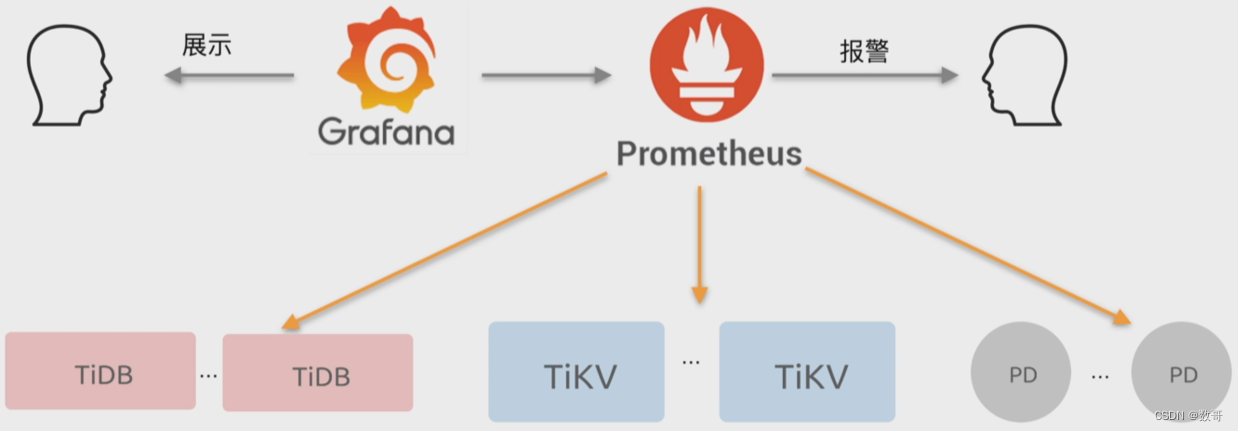
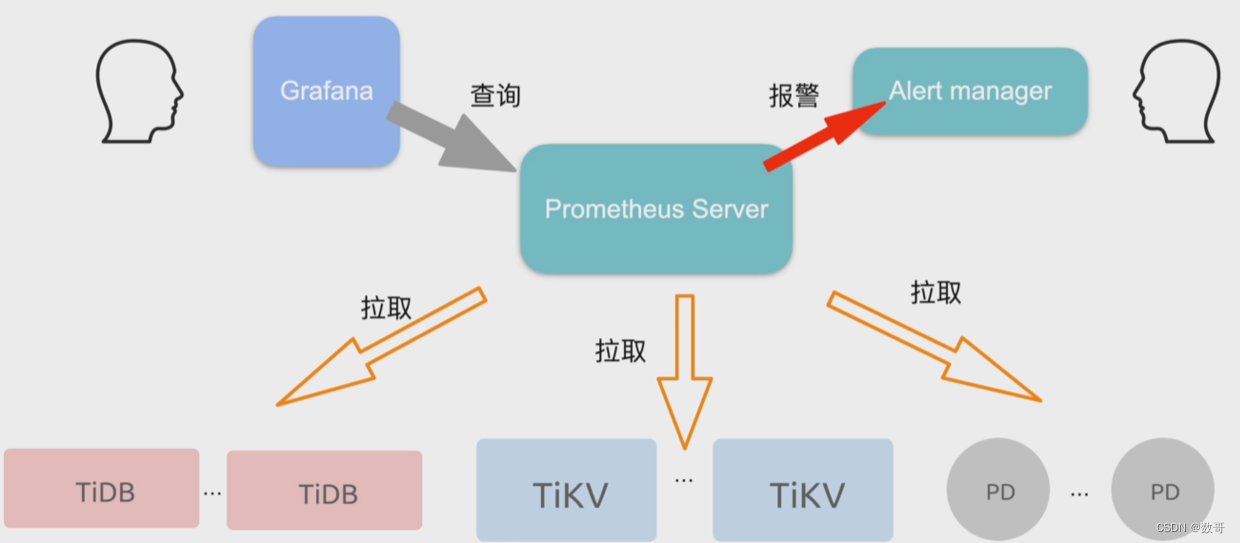
数据库监控系统数据流转
监控系统访问地址
- prometheus + grafana 的监控
http://{Grafana 的服务器IP地址}:3000
- TiDB Dashboard
http://{pd-ip}:2379/dashboard
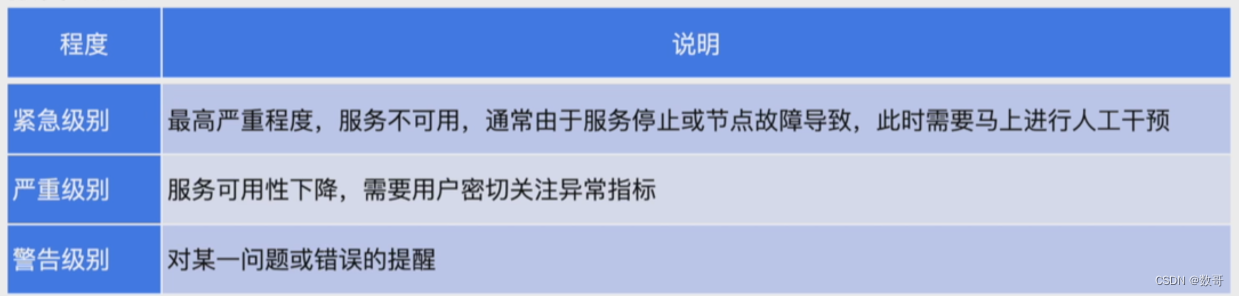
报警系统
报警级别
指标
- 指标
PD_cluster_offline_tikv_nums - 报警规则
sum(pd_cluster_status {type=“store_down_count”}) > 0 - 规则描述
PD长时间(默认配置是30分钟)没有收到TiKV心跳。
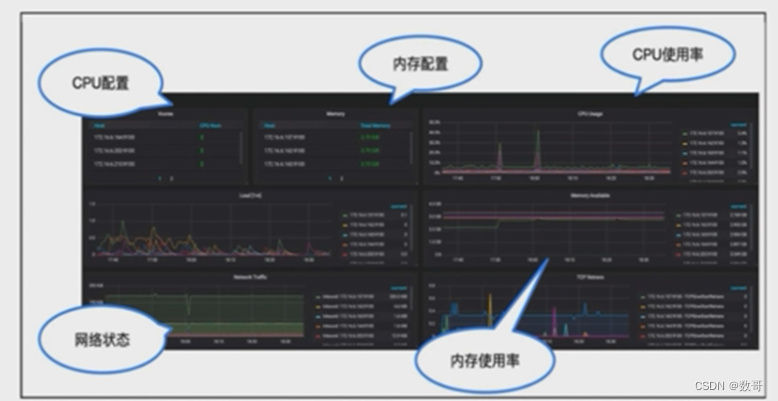
系统常用监控指标
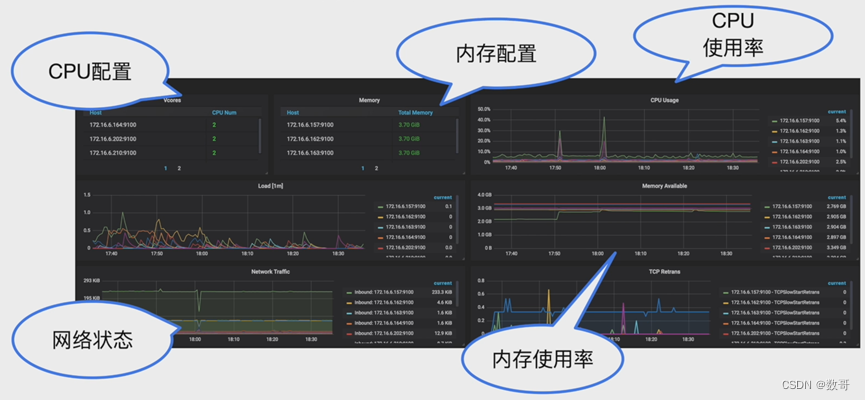
- CPU配置
- 内存配置
- 网络状态
- 内存使用率
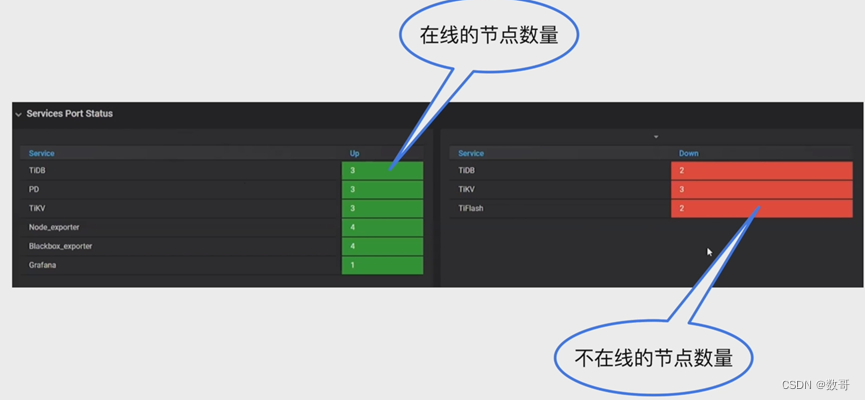
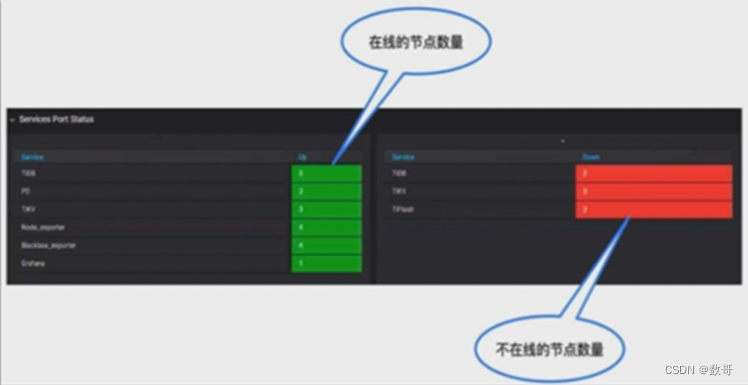
Service Port Status 常用监控指标
- 在线的节点数量
- 不在线的接待数量
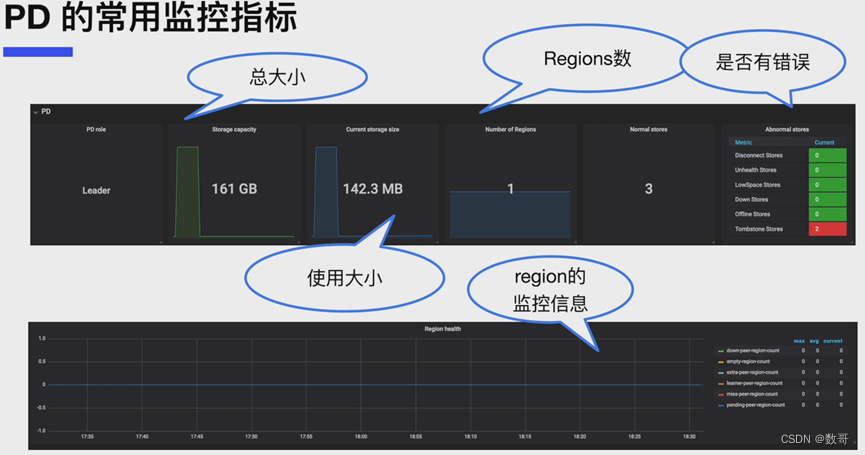
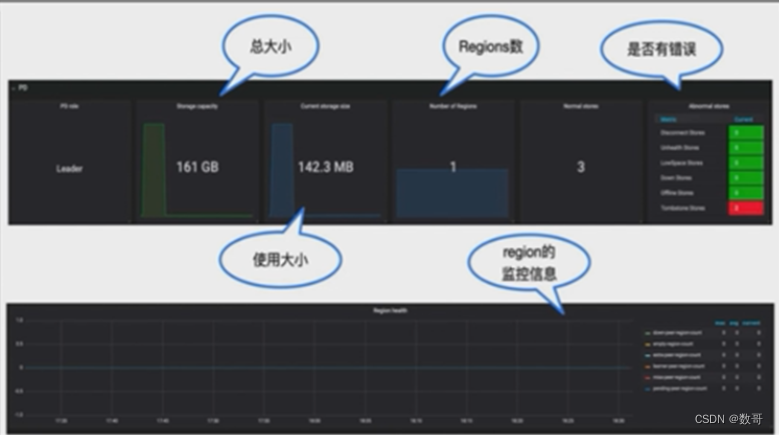
PD的常用监控指标
- 总大小
- regions数
- 是否有错误
- 使用大小
- region监控信息
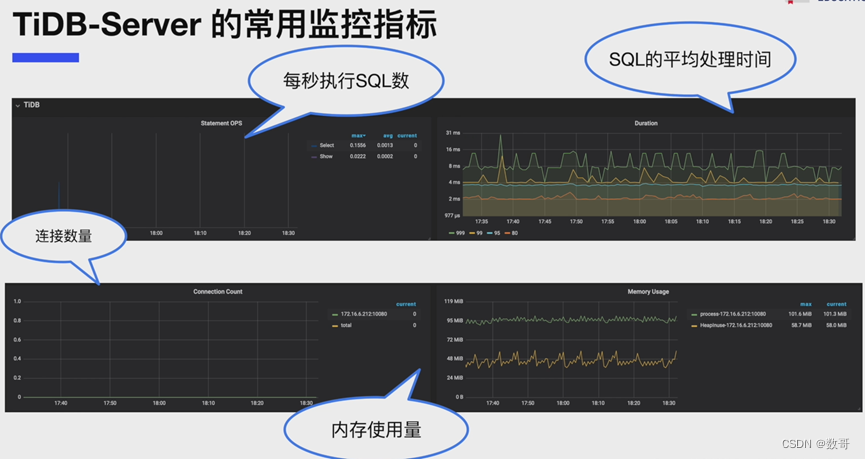
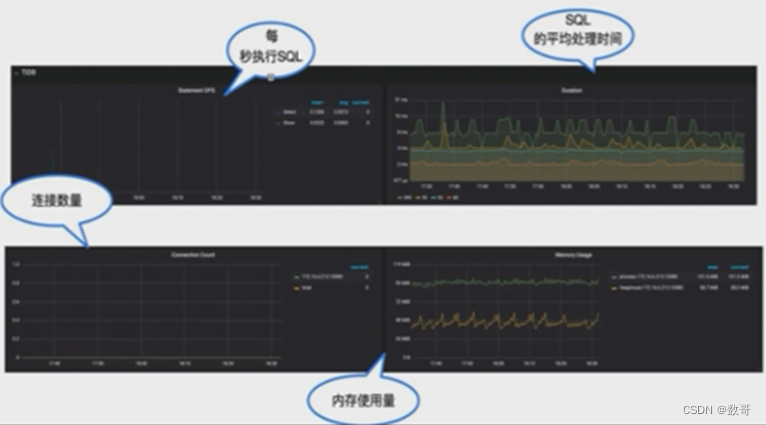
TiDBServer_68">TiDB-Server的常用监控指标
- 每秒执行SQL数量
- SQL的平均处理时间
- 连接数量
- 内存使用量
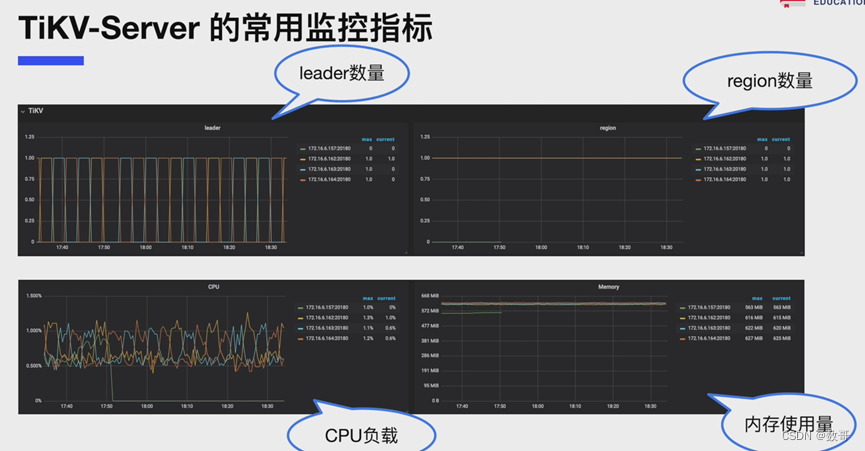
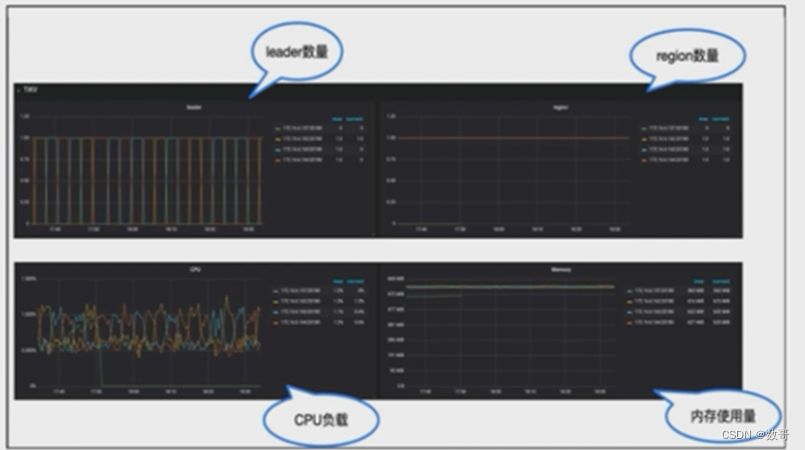
TiKV 的常用监控指标
- leader数量
- region数量
- cpu负载
- 内存使用量
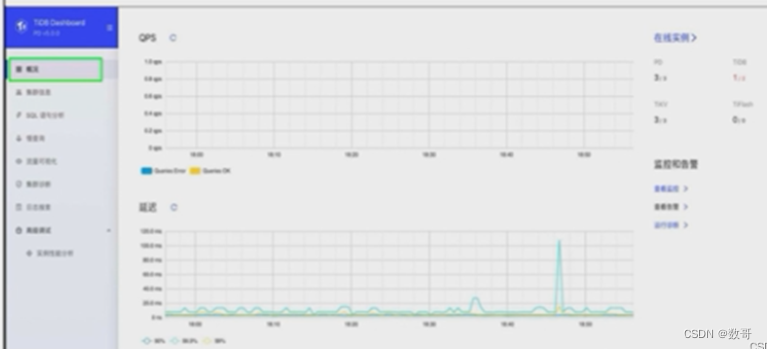
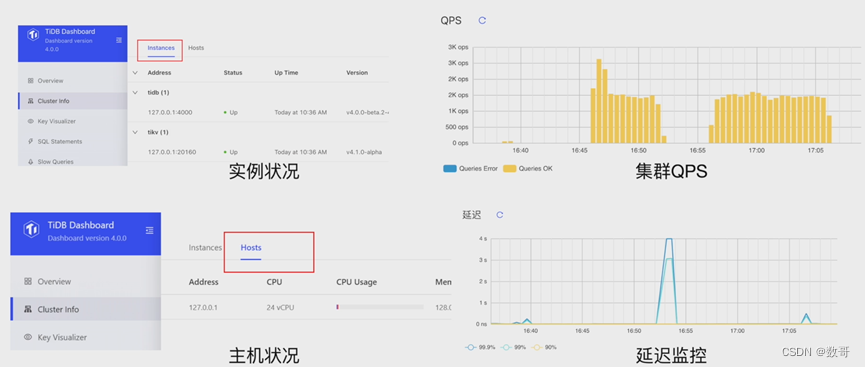
Dashboard的常用指标
- 实例状况
- 集群QPS
- 主机状况
- 延迟监控
实验: 通过监控工具查看相关指标
1、确认TiDB集群状态
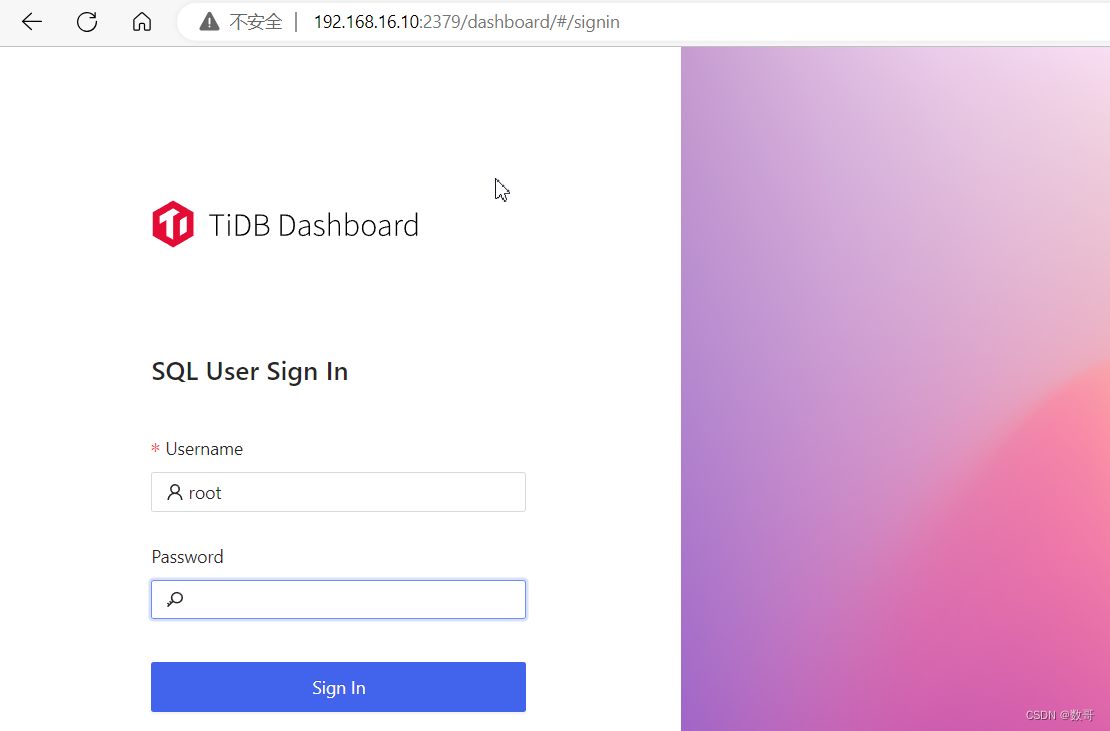
Dashboard URL: http://192.168.16.10:2379/dashboard
grafana URL:http://192.168.16.10:3000
[root@tiup pd-2379]# tiup cluster display tidb-test
tiup is checking updates for component cluster ...timeout(2s)!
Starting component `cluster`: /root/.tiup/components/cluster/v1.12.3/tiup-cluster display tidb-test
Cluster type:       tidb
Cluster name:       tidb-test
Cluster version:    v6.1.6
Deploy user:        root
SSH type:           builtin
Dashboard URL:      http://192.168.16.10:2379/dashboard
Grafana URL:        http://192.168.16.10:3000
ID                   Role          Host           Ports        OS/Arch       Status   Data Dir                      Deploy Dir
--                   ----          ----           -----        -------       ------   --------                      ----------
192.168.16.10:9093   alertmanager  192.168.16.10  9093/9094    linux/x86_64  Up       /tidb-data/alertmanager-9093  /tidb-deploy/alertmanager-9093
192.168.16.10:3000   grafana       192.168.16.10  3000         linux/x86_64  Up       -                             /tidb-deploy/grafana-3000
192.168.16.10:2379   pd            192.168.16.10  2379/2380    linux/x86_64  Up|L|UI  /tidb-data/pd-2379            /tidb-deploy/pd-2379
192.168.16.10:9090   prometheus    192.168.16.10  9090/12020   linux/x86_64  Up       /tidb-data/prometheus-9090    /tidb-deploy/prometheus-9090
192.168.16.10:4000   tidb          192.168.16.10  4000/10080   linux/x86_64  Up       -                             /tidb-deploy/tidb-4000
192.168.16.10:20160  tikv          192.168.16.10  20160/20180  linux/x86_64  Up       /tidb-data/tikv-20160         /tidb-deploy/tikv-20160
Total nodes: 6
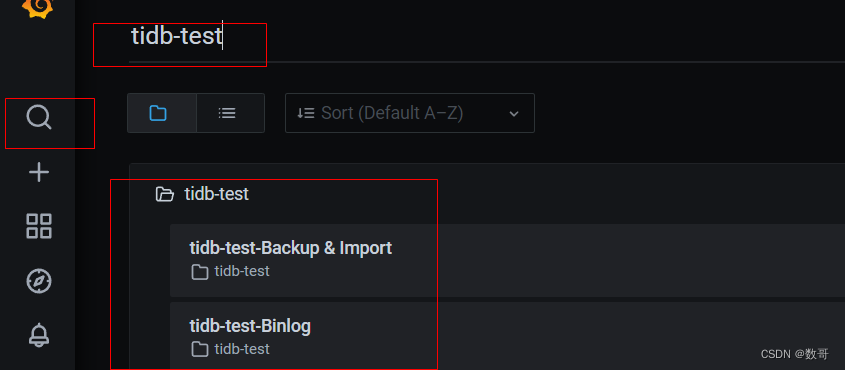
2、访问Grafana 监控,默认admin/admin

3、选择需要监控的实例tidb-test.
展开后找到tidb-test-overview,查看相应内容。

4、展开tidb-test-overview的system-info,查看整个TiDB数据库鄋的服务器监控指标
5、Service Port Status
收起system-info,展开tidb-test-overview的service port status,会看到各个节点在线状况
6、查看PD监控项
收起Service Port status,展开tidb-test-Overview的PD监控项,会看到各个PD节点的监控指标
7、查看TiDB监控项
收起PD监控项,展开tidb-test-Overview的TiDB监控项,会看到各个TiDB-Server节点的监控指标
8、查看TiKV监控项
收起TiDB监控项,展开tidb-test-Overview的TiKV监控项,会看到各个TiKV节点的监控指标
9、查看DashBoard
默认登录用户root,没有密码
10、查看TiDB的整体QPS 和 SQL延迟